Quick Order Analysis
Users can analyze the products added to quick order and assess multiple factors from the analysis. The results from the analysis are used for profit & loss comparison.
Analysis can be used to assess the net requirement of inventory items required to deliver the order.
The Analysis option is displayed only in the View mode of a saved quick order.
On clicking Analysis, users are directed to the Analysis screen that displays items with valid quantities mapped against them. The valid item quantity must be greater than zero.
Once the forecasting is completed, the requirements generated are auto filled and displayed in the following sections:
-
Item list
-
Shopping Cart section for purchasing
-
Engineering
Click Sales ➜ Quick Orders.
Click on the preferred quick order transaction from the Orders List section.
Click to open a saved quick order. The quick order details page appears.
Click Analysis. The Analysis page appears with the following tabs:
-
Item List - detailed analysis of the inventory items.
-
Shopping Cart - list of items in the shopping cart.
-
Engineering - provides detailed information on the cost/benefit accrued from the sale forecast of the products.
Item List
Users can view the detailed analysis of inventory items under this section and print or download the item analysis.
Click Analysis ➜ Item List. The Item List section appears with the following details:
|
Field |
Description |
|---|---|
|
Product ID |
The name of the item. |
|
Total Quantity |
The total quantity of the item that is selected for the product from the plan matrix. |
|
Unit |
The base unit of the item.
|
|
Price/Unit |
The price of the item per unit. |
|
Amount |
The total amount of the item. It is calculated as Quantity × Price. |
|
Actions |
Click the ellipses to select Item Sales. |
Click Expand All/Collapse All to see the product details.
Pricing
The Pricing tool forecasts the Price vs Cost parameters for all the products listed in the Analysis section. The results for Price vs Cost parameters are not displayed for individual items in the Analysis section.
Click Pricing on the top right-hand side of the Analysis page. The Pricing pop-up appears.
Refer to the following table and fill in the fields:
|
Field |
Description |
|---|---|
|
Total Cost |
The total cost of the products that appear in the Analysis section. This is a read-only field. |
|
Cost/Unit |
The cost of the item per unit. This is a read-only field. |
|
Price/Unit |
The price of the item per unit. The price/unit is calculated as 100 × (Unit Cost/Cost Percentage). |
|
Cost Percentage % |
It is calculated as 100 × (Unit Cost/Unit Price). |
|
Profit Margin % |
It is calculated as (Unit Price - Unit Cost)/Unit Price *100. |
|
Markup % |
It is calculated as (Unit Price - Unit Cost)/Cost Price *100. |
|
Reciprocal |
It is calculated as Unit Price/Unit Cost. |
|
Other |
Optional text field. |
Click Ok.
The results observed from the Pricing screen does not have any effect on the information in the Analysis section.
Scaling
Scaling allows users to scale the quantity of the products listed in the Analysis section and all other parameters are calculated from the product quantity.
The results scaling is displayed for individual items in the Analysis section, and the quantity gets scaled for each product listed in the Analysis section.
Click Scaling on the top right-hand side of the Analysis page. The Scaling pop-up appears.
Refer to the following table and fill in the fields:
|
Field |
Description |
|---|---|
|
Makes |
The value gets multiplied with the quantity of the product as displayed in the Analysis section. By default, the value is 1.00. |
|
Multiply By |
The value gets multiplied with the quantity of the product as displayed in the Analysis section. |
|
Scale By (%) |
The sales quantity is scaled up/down with respect to the percentage provided here. When user confirms the scaling data, the scaling effect alters the data in the table displayed in the Analysis section. |
|
Round Up |
The scaled quantity values are rounded off to the next nearest natural number by enabling this checkbox. For example, 4.34 is rounded off as 5.00. |
Click Update.
Print Worksheet
It shows the quantities of all recipes that require preparation, as well as the quantities of ingredients and sub-recipes for each recipe. Users can print worksheets for a single recipe, menu, or product, or for an entire sale plan.
Users are provided with multiple worksheet forms from which they can select a preferred form. Once the preferred worksheet is selected, Eatec migrates the data from the sales plan and integrates with the fields in selected form. The .rpt file format worksheet is converted into a .pdf file.
Perform the following steps to print or download the item analysis:
Click Print Worksheet that appears on the top right-hand side of the Analysis page. The Print Worksheet pop-up appears.
Enable the following checkboxes, if required:
-
Expanded List
-
Recipe Compilation
Select the preferred option from the Form drop-down list:
-
Standard Work Form
-
Master Recipes Scaled
-
All Recipes Scaled
-
Recipe Summary
-
Finished Goods Summary
Click Print. The PDF opens in a web browser.
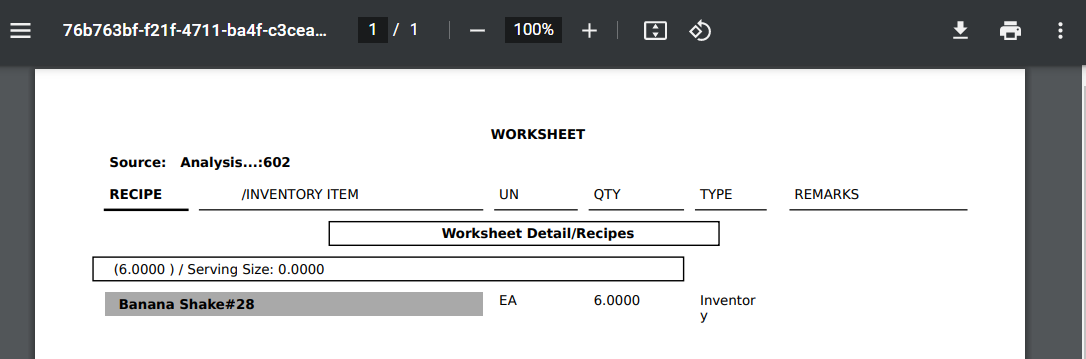
Sample Print Worksheet
Click the Print option from the PDF. The print setup appears.
Select the preferred destination.
Click Print.
Shopping Cart
Users can analyze the plan parameters in the Analysis section. Shopping Cart includes the list of inventory items to be purchased. This section allows users to utilise any existing shopping list or create new a shopping list from the data available in the Analysis section.
If the products require procurement of inventory items to satisfy the plan requirement, users can navigate to the Shopping Cart section.
Users can save the shopping list and provide a name to the list. Users can migrate the list to different procurement modules such as,
-
Paste into Requisition
-
Paste into Purchase Order
-
Paste into Receiving
-
Paste into Purchase Request
Users can perform the following functions under the saved Shopping List:
-
Modify the saved shopping list & overwrite the changes
-
Modify and save as new shopping list
-
Rename the saved shopping list
-
Delete the saved shopping list
Perform the following steps to create a new inventory item list:
Click Analysis ➜ Shopping Cart.
Click Create New List. The New List pop-up with conditional parameters appears.
Select or multiselect the preferred checkbox corresponding to the following options:
-
Explode Production Items
-
Round Quantities Up
-
Add Waster Factor
-
Exclude Zero Items
-
Exclude Selected Group
-
Consider Quantity on Order
-
Consider Quantity on Hand
-
Drop Production Items
-
Consider Quantity on Requisition
Based on the selected checkboxes the inventory items list is saved.
Refer to the following table and fill in the fields:
|
Field |
Description |
|---|---|
|
Location(s) |
Select a location to be filtered. |
|
Inventory Type(s) |
Select an inventory type to be filtered. |
|
Class(es) |
Select a class to be filtered. |
|
Package(s) |
Select a package to be filtered. |
|
Group by |
Select a group of the product from the following options:
|
Click Apply. The Results section appears with the following details:
|
Field |
Description |
|---|---|
|
Inventory Item/Recipe |
The name of the item/recipe. |
|
Quantity Required |
The quantity of the item that is required for the sale plan. |
|
Quantity on Hand |
The count (in base units) of current global inventory based on the most recent transactions and postings. |
|
Quantity on Req. |
The global count (in base units) of the total quantity of an item that is on requisition. |
|
Quantity on Order |
The global count (in base units) of inventory items due to arrival, based on outstanding purchase orders. |
|
Quantity |
The total quantity of the item required for the sale plan. |
|
Unit |
The unit of the item. |
|
Price/Unit |
The price per unit for an item. |
|
Amount |
The total amount of the item. |
|
Supplier |
The name of the supplier. |
Enter a name for the item/product in the Name field.
Click Save to save the item. The saved information appears in the Saved List section.
Click Save As to rename and save as a new item in the shopping cart. This option gets enabled only when users save the new item at least once.
Users can also post the inventory item list by selecting any of the following options:
-
Paste into Requisition - directs the user to the Requisitions page when clicked. Items available on the Analysis page must be entered to create a new requisition. Items are converted to transaction units on the Requisitions page.
-
Paste into Purchase Order - directs the user to the Purchase Order page when clicked. Items available on the Analysis page must be entered to create a new purchase order. Items are converted to transaction units on the Purchase Order page.
-
Paste into Receiving - directs the user to the Receiving page when clicked. Items available on the Analysis page must be entered to create a new receiving. Items are converted to transaction units on the Receiving page.
-
Paste into Purchase Request - directs the user to the Purchase Request page when clicked. Items available on the Analysis page must be entered to create a new purchase request. Items are converted to transaction units on the Purchase Request page.
Engineering
This section provides a detailed view of data related to the cost/benefit accrued from the sale forecast of the products selected for Analysis.
The information displayed in the Engineering section is retrieved from the data in the Analysis section. Users cannot modify the details in this section. This section provides information in the read-only format.
Click Sales ➜ Quick Orders.
Click to open a saved quick order transaction.
Click Analysis ➜ Engineering. The Engineering tab appears with the following details:
|
Field |
Description |
|---|---|
|
Product Item |
The name of the product. |
|
Sales Qty |
The total sales of the quantity retrieved from the Analysis section. |
|
Mix % |
The sales mix as a percent of the total forecasted sales. This is calculated as, Sale Quantity of the Product/Total Sales Quantity) * 100. |
|
Cost / Unit |
The cost mentioned in the sale plan matrix. The unit cost. |
|
Price / Unit |
The price mentioned in the sale plan matrix. The unit price. |
|
Margin / Unit |
The difference between price and cost for each product. |
|
Total Cost |
The forecast of the total cost incurred. This is calculated as, Sales Quantity * Cost. |
|
Revenue |
The forecast of the revenue generated. This is calculated as, Sales Quantity * Price. |
|
Total Profit |
The forecast of total profit earned. This is calculated as Revenue - Total Cost. |
|
Profit Group |
Grouped according to gross profit cover or margin.
|
|
Mix % Class |
Grouped according to the Sale Mix %.
|
|
Item Class |
Products are grouped according to the Profit and Mix % group. They are indicated with the following:
|
|
Profit Factor |
Profit factor is defined as follows,
|